Analytics
Helpfruit analytics helps you understand how people use your bot, what they ask, how well answers perform, and where your knowledge base may need more content. Use the analytics pages to review traffic, conversations, Q&A performance, live chat, ticketing, and user behaviour.
In this article
Analytics screens
In Helpfruit, users can review different analytics screens:
- Overview
- Traffic
- Q&A
- Conversations
- Live chat*
- Ticketing*
* will only show data if these features are enabled
Filter analytics results
-
Choose a date range. The default is last month.
Select Show results from and choose a period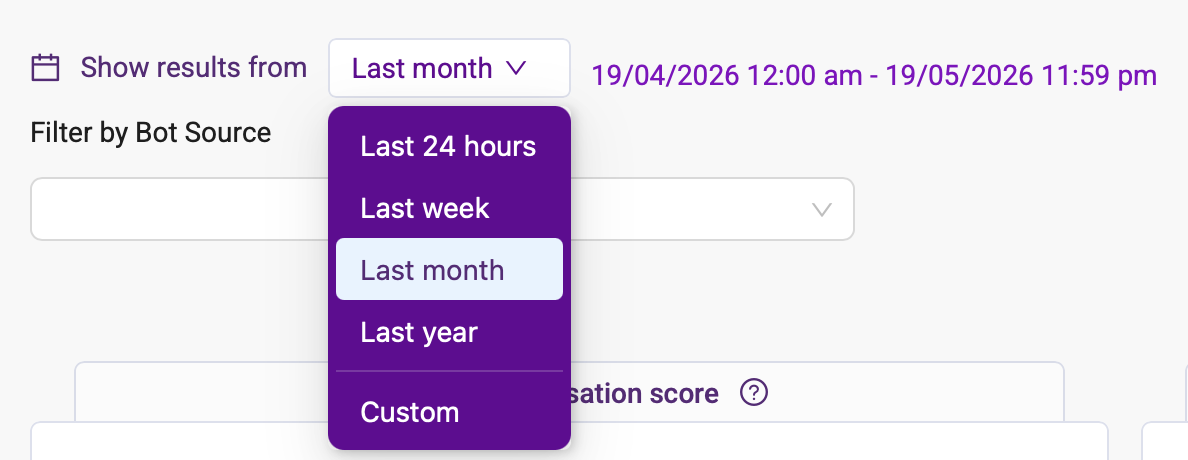
-
Check the exact date and time range.
Helpfruit shows the selected range beside the date filter. -
Filter by bot source.
Use Filter by Bot Source to view analytics for a specific source, such as web or another connected channel. -
Review the charts and tables.
The data shown on the page updates based on the selected filters. - If the data is taking a long time to load, consider a shorter date range.
Use the overview page
The Overview page gives you a high-level view of bot performance for the selected date range and source.
Use it to review:
- Average conversation score – shows the average conversation score out of 5
- Average conversation score over time – shows how the average score changes over the selected period
- Messages – shows how many messages were received
- Questions answered – shows how many questions the bot answered
- Users – shows the number of users for the selected period and source
- Conversations – shows the number of conversations for the selected period and source
- How were user messages handled? – shows how messages were classified, such as Q&A, No answer, Form, AI assistant, and Chit-chat
- Recent messages – shows recent user messages for a snapshot of what people asked
- What are users talking about? – shows a word cloud of common terms used by users
- What does your KB cover? – shows a word cloud of terms covered by your knowledge base
Use the overview page to spot trends quickly, then open the related analytics section for more detail.
Use the traffic page
The Traffic page helps you understand how busy your bot was and when users interacted with it.
Use it to review:
- How busy was your bot? – shows user activity over the selected date range
- Users in the last 12 hours – shows recent user activity by time of day
- How many messages received throughout the day? – shows average message volume by time of day
- New vs Returning Users – shows how users are split between new and returning users
Use this page to identify peak periods, quiet periods, and patterns in user activity.
New vs returning users
The New vs Returning Users chart is based on a user-tracking record stored in the user’s browser.
- New user means the browser does not currently have Helpfruit’s user-tracking record.
- Returning user means the browser already has Helpfruit’s user-tracking record.
This means the chart is best understood as a browser-based measure, not a guaranteed count of unique people.
A person may be counted as a new user if they:
- use a different browser
- use a different device
- clear their browser data
- use private or incognito browsing
- have browser settings or extensions that block or remove local storage
- access the bot in a way that prevents the tracking record from being saved
For example, the same person may appear as new if they use Chrome on a laptop, Safari on a phone, and a private browsing window.
Use the Q&A page
The Q&A page helps you understand how users rate answers and which answers appear most often.
Use it to review:
- How did users rate your answers? – shows answer feedback: Helpful, Unhelpful and No response
- Most common Q&A answers – shows answers that were returned most often and how frequently they appeared in the specified period
Use the conversations page
The Conversations page helps you understand the tone, structure, and content of user conversations.
Use it to review:
- Conversation sentiment – shows the share of conversations identified as Negative, Neutral, and Positive
- Messages per conversation – shows the average number of messages in each conversation
- What languages were used? – shows the languages used in conversations
- What are the most popular chit-chat categories? – shows common chit-chat categories
- Recent messages – shows recent conversation examples
Use this page to understand how users interact with the bot and whether conversations are short, complex, positive, or difficult.
Analytics vs insights
Analytics screens give you an overall picture of how users are interacting with your chatbot, and allow you to track performance over time.
Insights (Q&A and Conversation) allow you to look more closely at individual interactions. From insights you can:
- Make changes to your Q&A
- Create a ticket (if ticketing is enabled)
- See the detail of individual conversations
- Find specific questions, answers, or types of interaction
Learn more about Q&A and Conversation insights.